Wireline logs are a graphic representation of various tool responses with regards to depth. In order to interpret the responses accurately, the individual must be able to read the graphic numeric response. The petroleum industry has a standard format which is used in recording logging measurements (Figure 1-1). This API log grid has a width of 8.25 inches and is divided into three tracks and a depth column. The log has one track on the left side of the depth column and two on the right. Each track is 2.5 inches wide, while the depth column is 0.75 inches wide. Each track is scaled, referred to as the grid scale, and there are three types: linear, logarithmic and split grid.
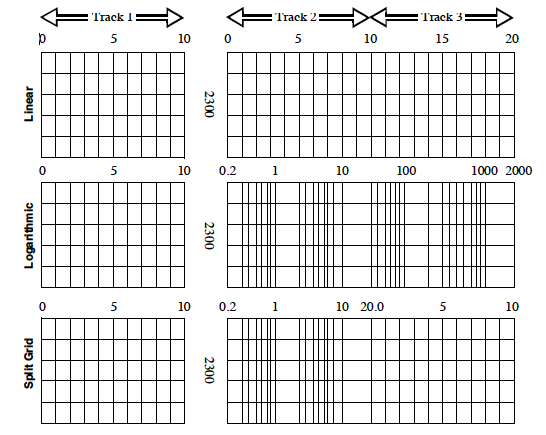
Figure 1-1: API Recording Formats
Depth Scales
The depths recorded in the depth column represent measured depth. The most common scales begin:
1 inch - 100 feet (1:1200)
2 inches - 100 feet (1:600)
5 inches - 100 feet (1:240)
If you like what you're reading, click an ad to say thanks.
The 1 inch and 2 inch scales are usually used for correlation purpose, while the 5 inch scale is usually available for scrutiny of sections. On the 1 and 2 inch depth scales, each major division represent 100 feet of hole. Each subdivision indicates 10 feet of hole. On the 5 inches scale, each subdivision indicates 2 feet of hole.
Grid Scales
The linear grid is usually the easiest to read. Track #1 is always linear. A linear grid represent functions that have a straight line or corresponding relationships of constant value. The logarithmic scale, in Track 2 and 3, is usually a 4-cycle logarithmic scale. It is used for resistivity curves since it provides a greater range of values. A common scale is 0.2 ohms to 2000 ohms. The split grid is a two-cycle logarithmic scale and linear grid. Track 2 is usually the logarithmic grid with a common scale of 0.2 ohms to 20 ohms. This allows more accurate reading of low resistivity values. Track 3 would be the linear grid.