Facts:
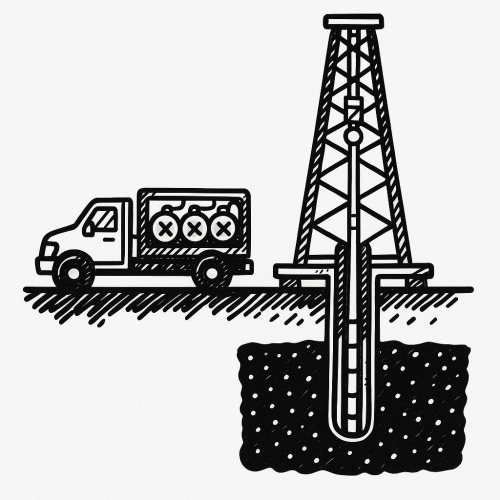
Crude oil is a form of liquid petroleum, extracted from rock formations and used for fuel and other purposes.
Crude oil is a form of liquid petroleum, extracted from rock formations and used for fuel and other purposes.
Members of the Organization of the Petroleum Exporting Countries (OPEC) produce about 43% of the world's crude oil, and possess almost 81% of the world's total proven crude oil reserves, according to OPEC and U.S. Energy Information Administration data.
The 13 countries/members of OPEC: Algeria, Angola, Ecuador, Gabon, Iran, Iraq, Kuwait, Libya, Nigeria, Qatar, Saudi Arabia, United Arab Emirates and Venezuela.
The following countries have the world's largest reserves of crude oil, according to the US Energy Information Administration (as of 2015):
-- Venezuela - 298 billion barrels
-- Saudi Arabia - 268 billion barrels
-- Canada - 172 billion barrels (non OPEC country)
-- Iran - 158 billion barrels
-- Iraq - 144 billion barrels
-- Kuwait - 104 billion barrels
-- United Arab Emirates - 98 billion barrels
-- Russia - 80 billion barrels (non OPEC country)
-- Libya - 48 billion barrels
-- Nigeria - 37 billion barrels
Production and Consumption in the US:
In 2015, the United States produced about 9.4 million barrels of crude oil per day.
In 2015, the United States produced about 9.4 million barrels of crude oil per day.
The United States leads the world in total petroleum production, producing over 15,000 barrels a day in 2015, ahead of Saudi Arabia and Russia.
The United States consumed an average of 19.11 million barrels of petroleum products per day in 2015.
The United States is the world's largest consumer of petroleum products.
In 2015, about 24% of the petroleum used in the United States was imported, the lowest annual average since 1970, according to the US EIA. About 40% of this petroleum is imported from Canada.
US independence on imported oil peaked in 2005.
Timeline:
1973-1974 - Due to US support of Israel in the Arab-Israeli conflict, the members of OPEC decide to raise the cost of oil from $3/barrel to around $12/barrel.
1973-1974 - Due to US support of Israel in the Arab-Israeli conflict, the members of OPEC decide to raise the cost of oil from $3/barrel to around $12/barrel.
October 1973 - OPEC issues an embargo that halts exports of oil to the United States. Americans experience long lines at gas stations and at times cannot find gasoline at all. Gasoline prices go from 36 cents a gallon in 1972 to over 50 cents a gallon in 1973.
March 18, 1974 - At an OPEC meeting, seven members lift the ban on exports to United States. The countries are Algeria, Saudi Arabia, Kuwait, Qatar, Bahrain, Egypt and Abu Dhabi. Libya and Syria refuse to drop the ban and Iraq boycotts the talks.
December 31, 1974 - Libya lifts its 14-month-old oil embargo against the United States.
December 22, 1975 - US President Gerald Ford establishes the Strategic Petroleum Reserve when he signs into law the "Energy Policy and Conservation Act." The law is created in response to the oil embargo of 1973-1974 and the severe effect it had on the economy. It mandates that the country maintain a stockpile of one million barrels of petroleum, which is the largest emergency supply in the world.
July 3, 2008 - U.S. light, sweet crude oil settles at $145.29 a barrel on the New York Mercantile Exchange, a new record closing high.
July 3, 2008 - U.S. light, sweet crude oil hits an all-time intraday high of $145.85.
September 22, 2008 - Oil prices experience the biggest one-day increase ever, settling up $16.37 to $120.92 a barrel.
2013 - The United States imports less foreign oil than it produces for the first time in nearly two decades.